Welcome to the future: 5 ways the world is fighting climate change from space
Satellites have been watching the Earth’s surface for decades, monitoring changes on the land, seas and air. They’ve borne witness to rising sea levels, more intense droughts and more frequent strong hurricanes — hallmarks of a warming planet.
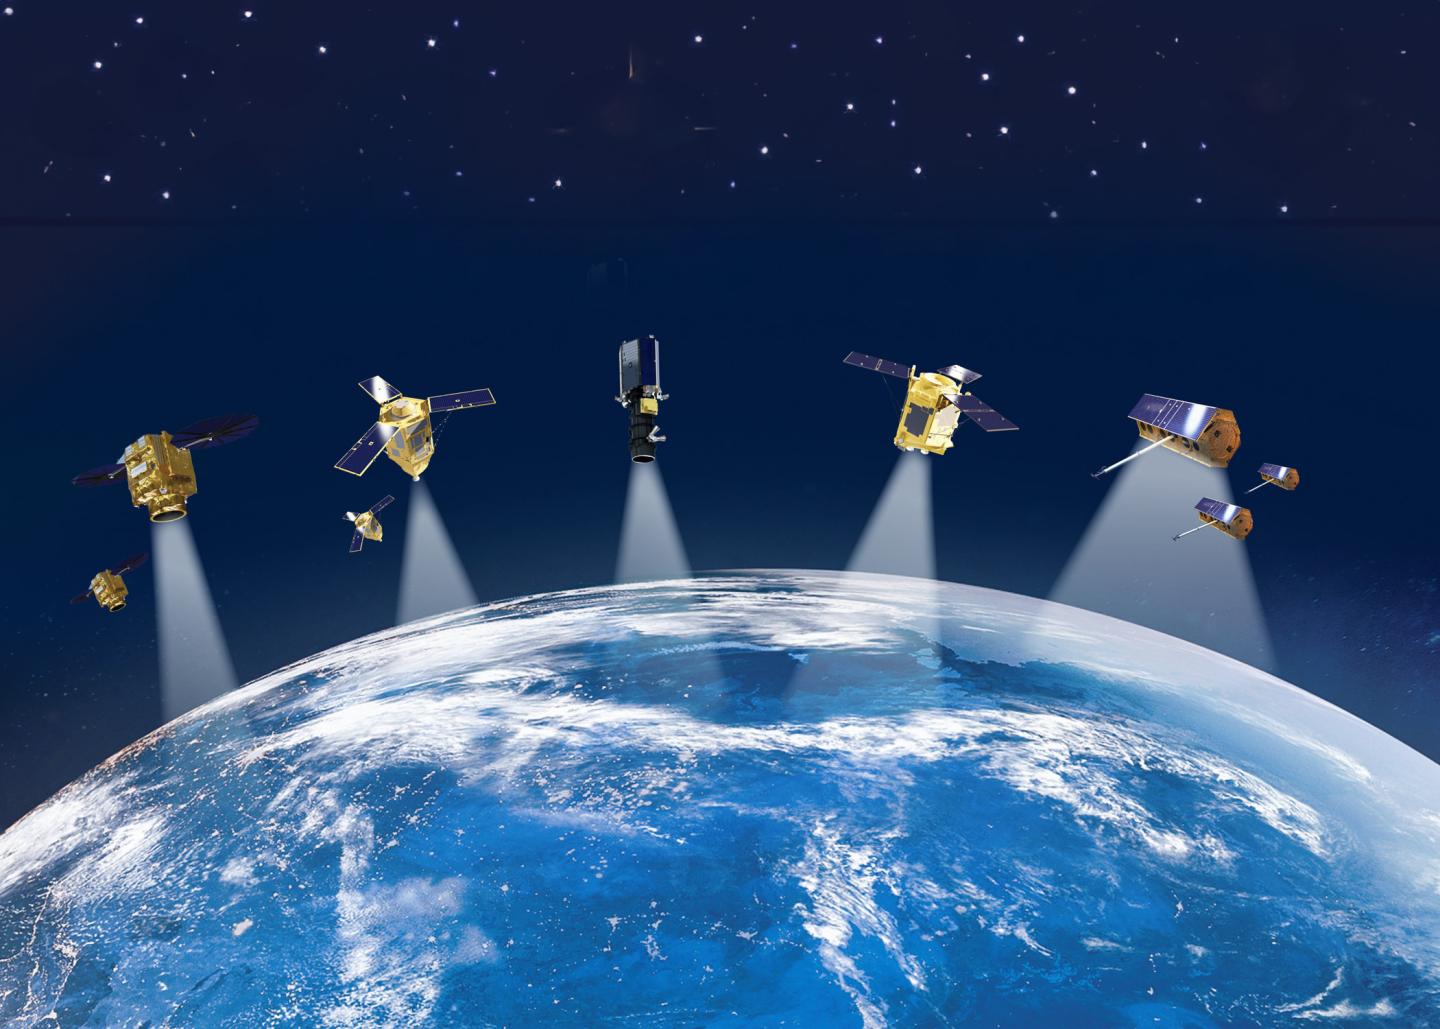
Today, satellite observations are more detailed and frequent than ever before. More than 1,000 earth-observing satellites are in orbit today, and they’re not just reflecting back images of a changing climate — they’re helping us figure out what to do about it.
From holding polluters accountable to targeting disaster response, here are five ways satellites are helping combat climate change.
Cutting climate pollution from methane
Methane is a powerful greenhouse gas, and reducing methane pollution now can produce urgently needed climate results — lower global temperatures than we might otherwise expect in this decade. Reducing warming means reducing the risk of wildfires, drought and other dangerous disruptions. It also means cleaner air and healthier communities.
The U.S., EU, China and prominent companies are all taking steps to reduce methane pollution. But in order to make sure reductions happen, we need to measure and track methane pollution from millions of sources all over the planet — with speed, precision and transparency.
That’s no small task.
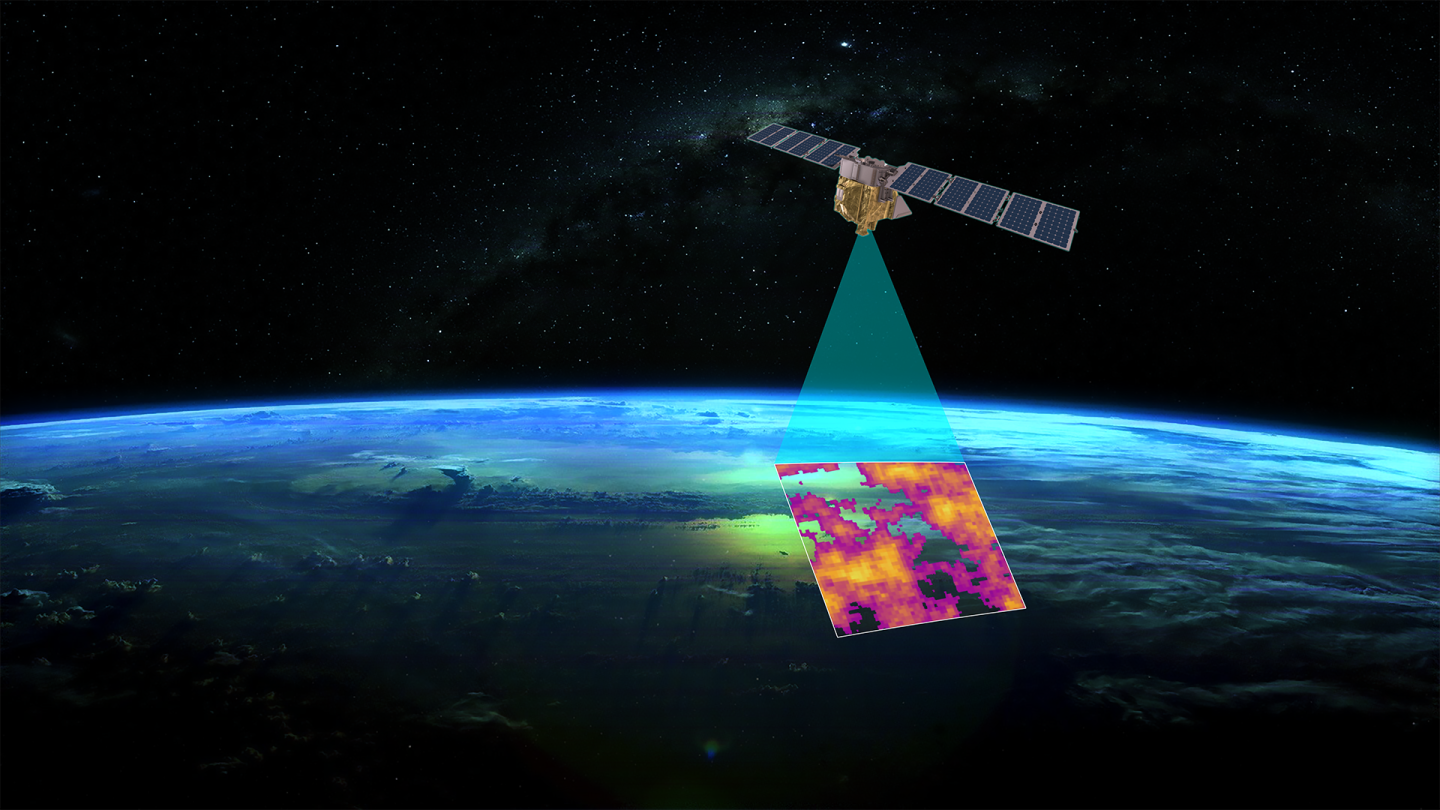
Enter MethaneSAT, created by a subsidiary of the global nonprofit Environmental Defense Fund. The satellite, scheduled to launch in 2024, is built for this exact purpose: to galvanize reductions in methane pollution and slow down climate change.
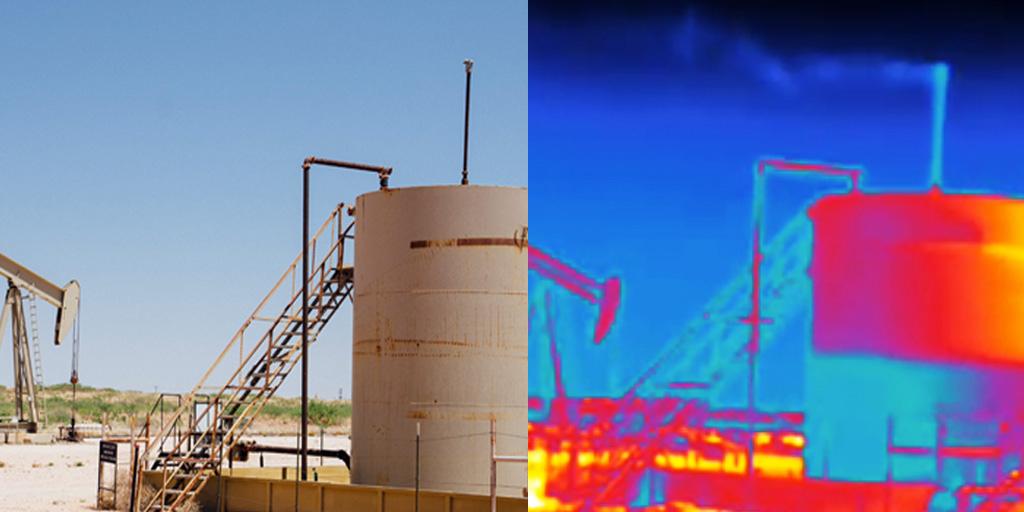
MethaneSAT will measure methane pollution over most of the world’s major oil producing regions — the oil and gas industry is a major source of this pollution, since methane is the main component of natural gas.
It can not only identify and measure emissions from large sources, but can also sniff out just a few parts per billion of excess methane in the atmosphere. This high sensitivity allows MethaneSAT to see emissions that have been previously invisible, and, for the first time, to determine the full picture of methane emissions over wide areas. Research suggests diffuse sources account for a large share of total methane emissions.
And to prompt fast action, MethaneSAT will produce measurements in a matter of days, instead of what currently takes weeks or months. It can also track methane emissions from agriculture, another major source of methane pollution, along with other sources.
By making frequent repeat visits, and sharing its data publicly, MethaneSAT will leave polluters with nowhere to hide. EDF, the International Energy Agency, the UN and others have formed an alliance to use data from multiple satellites, including MethaneSAT, to track companies’ methane performance around the world.
“If anyone fails to meet their commitments, we’ll all know it,” says EDF president Fred Krupp.
Zooming in on Earth’s imperiled coasts
As sea levels rise in the coming years, communities will be forced to make difficult decisions about which businesses, homes and infrastructure should and can be protected from floods, and how best to do so.
But to date, scientists monitoring Earth’s rising oceans have had to rely on piecemeal and imprecise data. Tidal gauges on coastlines have provided some data on rising sea levels which can help predict future scenarios, but these gauges aren’t distributed equally around the world. And conventional satellites using altimeters — which bounce radar off surface features to measure their height — can’t get a clear picture of what’s happening along the complex topography of coastlines where 40% of the world’s population lives.
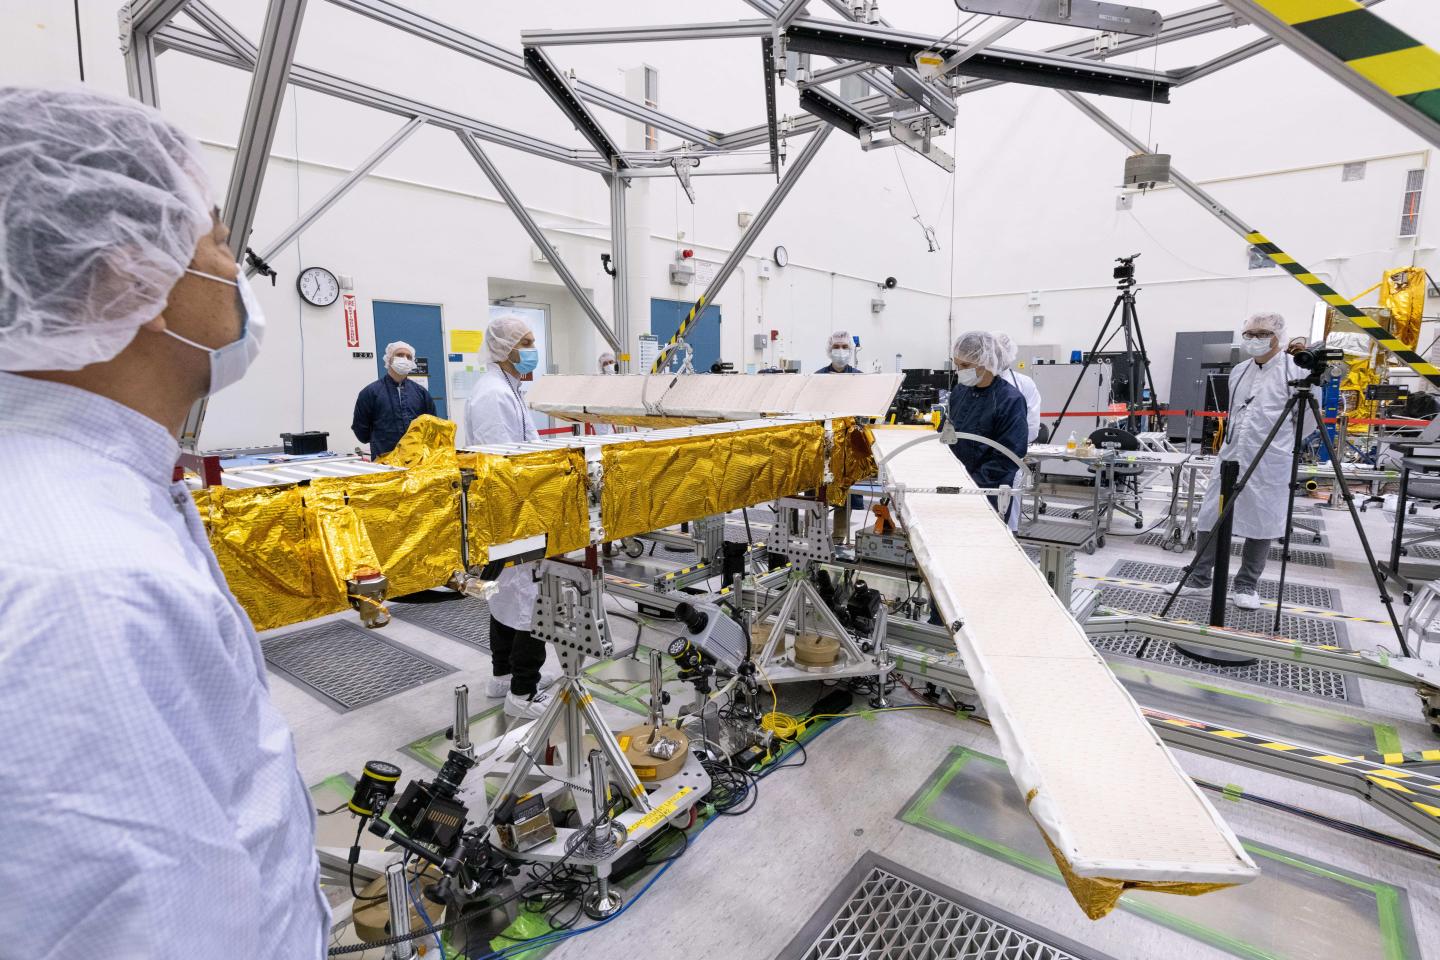
Now, thanks to NASA’s recently launched Surface Water and Ocean Topography, or SWOT, satellite, scientists will be able to measure sea-surface height with 10 times higher spatial resolution than any previous satellite.
The satellite will be capable of measuring sea-surface height within a few miles of the coast and even within estuaries and river deltas worldwide.
“SWOT will really zoom in on coastlines and finally bring into focus what’s happening in these densely populated and highly vulnerable places,” said Tamlin Pavelsky, a University of North Carolina researcher and the SWOT team’s hydrology science lead. “It will revolutionize coastal science.”
The secret to such high-resolution pictures is SWOT’s Ka-band Radar Interferometer. It bounces radar pulses off the ocean’s surface and captures them on return with two antennas at opposite ends of a 33-foot long boom, mounted atop the satellite. That allows the antennas to scan two parallel swaths of Earth’s surface on either side of the SUV-sized satellite and precisely triangulate the height of water.
SWOT was jointly developed and managed by NASA and CNES, the French space agency, with support from both the Canadian and UK space agencies. The satellite launched on December 16, 2022, and is scheduled to gather data for at least three years.
Helping farmers do more with less
It’s clear that in a warming world, droughts will be longer and more intense, and farmers will need to maximize what they get out of every drop of water. But until recently, this has been nearly impossible, because while farmers can measure how much rainfall they are getting, and how much water they are putting on their crops, they haven’t had a good measure of how much water is evaporating from their fields.
“It’s like trying to balance your checkbook without knowing how much you’re spending,” says Maurice Hall, senior advisor for climate resilient water systems at Environmental Defense Fund.
Now, thanks to OpenET, all that is changing.
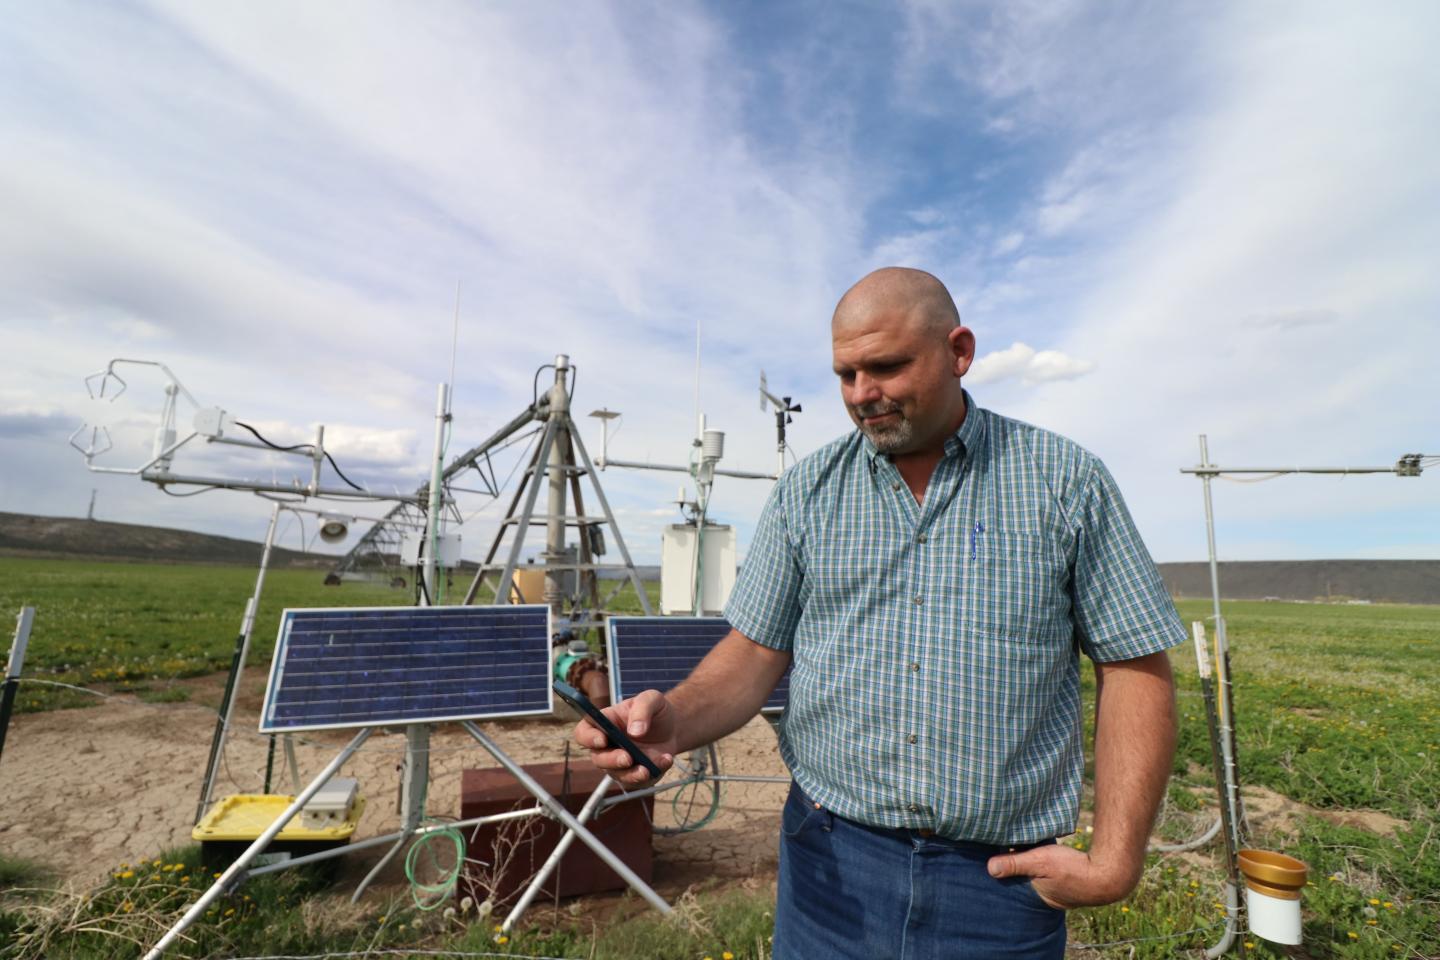
OpenET is an online platform that uses satellite and weather station data to estimate field-level water consumption at daily, monthly and yearly intervals. It launched in 2021, using thermal and reflectance data collected by NASA’s Landsat family satellites.
The platform is a collaboration between the Environmental Defense Fund, NASA, the Desert Research Institute, web developer Habitat Seven, and a host of science partners, with support and computing resources from Google Earth Engine.
The “ET” in OpenET stands for evapotranspiration, or the process by which water evaporates from the surface of the land or transpires from plants. For most crops, ET is a key measure of the amount of water that needs to be provided through irrigation or precipitation. Knowing how much water is transferred to the air through ET allows farmers to more precisely calculate how much water their crops really need, helping them to use water more strategically and efficiently, and better understand how much water is saved by conservation measures.
Key to OpenET’s modeling is the fact that evapotranspiration causes a temperature dip that can be measured from space. So farm fields and other landscapes consuming more water appear cooler to LandSAT’s thermal infrared sensor.
“Until OpenET, there was no single, low-cost operational system for measuring and distributing evapotranspiration data at the scale of individual fields across the western United States,” said EDF’s Hall. “Water is becoming a scarce resource in the West that we all need to share. Now that we can all work off of the same data, we can be smarter and more strategic in how we use it.”
Preventing deforestation
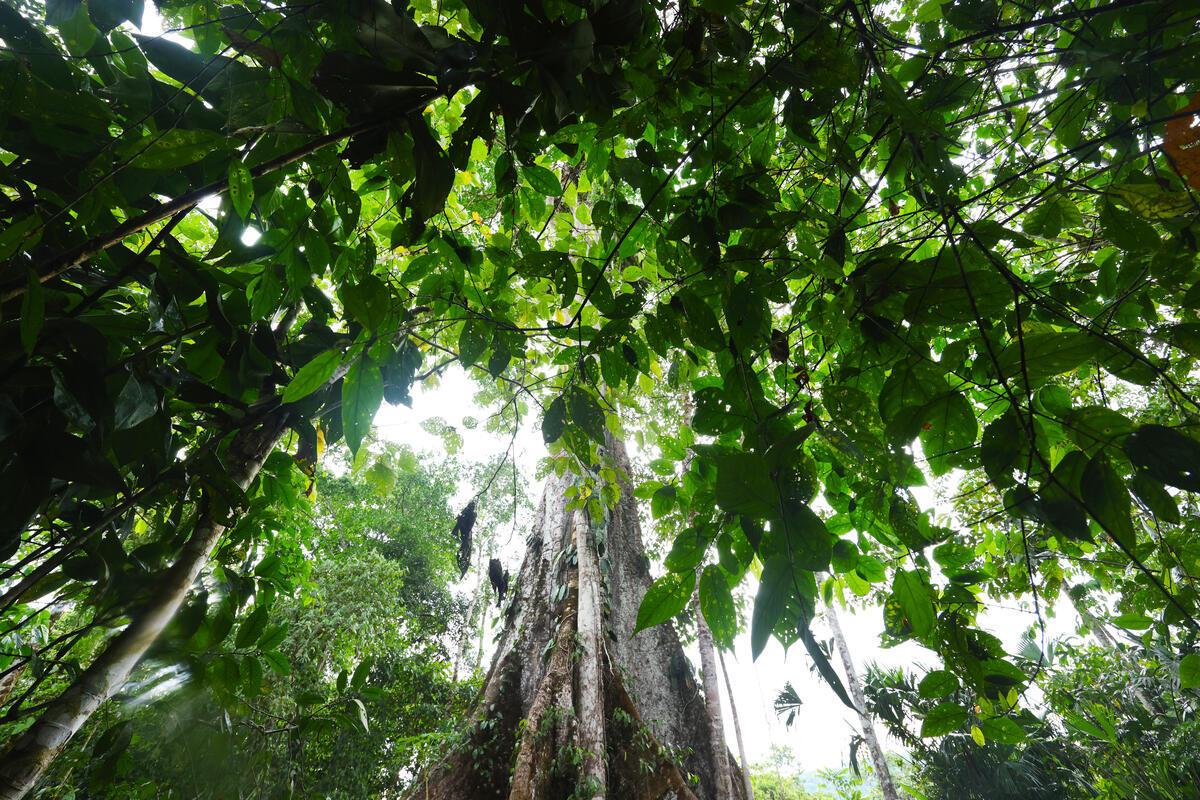
Keeping forests alive and healthy is critical to the climate fight. But to combat deforestation, it helps to know exactly what’s happening in forests, and where. That means tracking even small changes in forest cover over huge areas of land, often in remote areas that are obscured by clouds.
Until recently, researchers monitoring tropical deforestation relied mainly on medium-resolution satellite images analyzed by human eyes, combined with on-the-ground mapping efforts. The resulting data provided a yearly view of tropical forests, at a resolution of 30 meters. This has been helpful in tracking long-term trends in deforestation, but doesn’t pinpoint destruction as it’s happening.
That’s starting to change with microsatellites that can take more frequent, higher resolution images. And a new satellite, slated to launch in early 2024, will be able to capture data regardless of weather, day or night, by using radar.
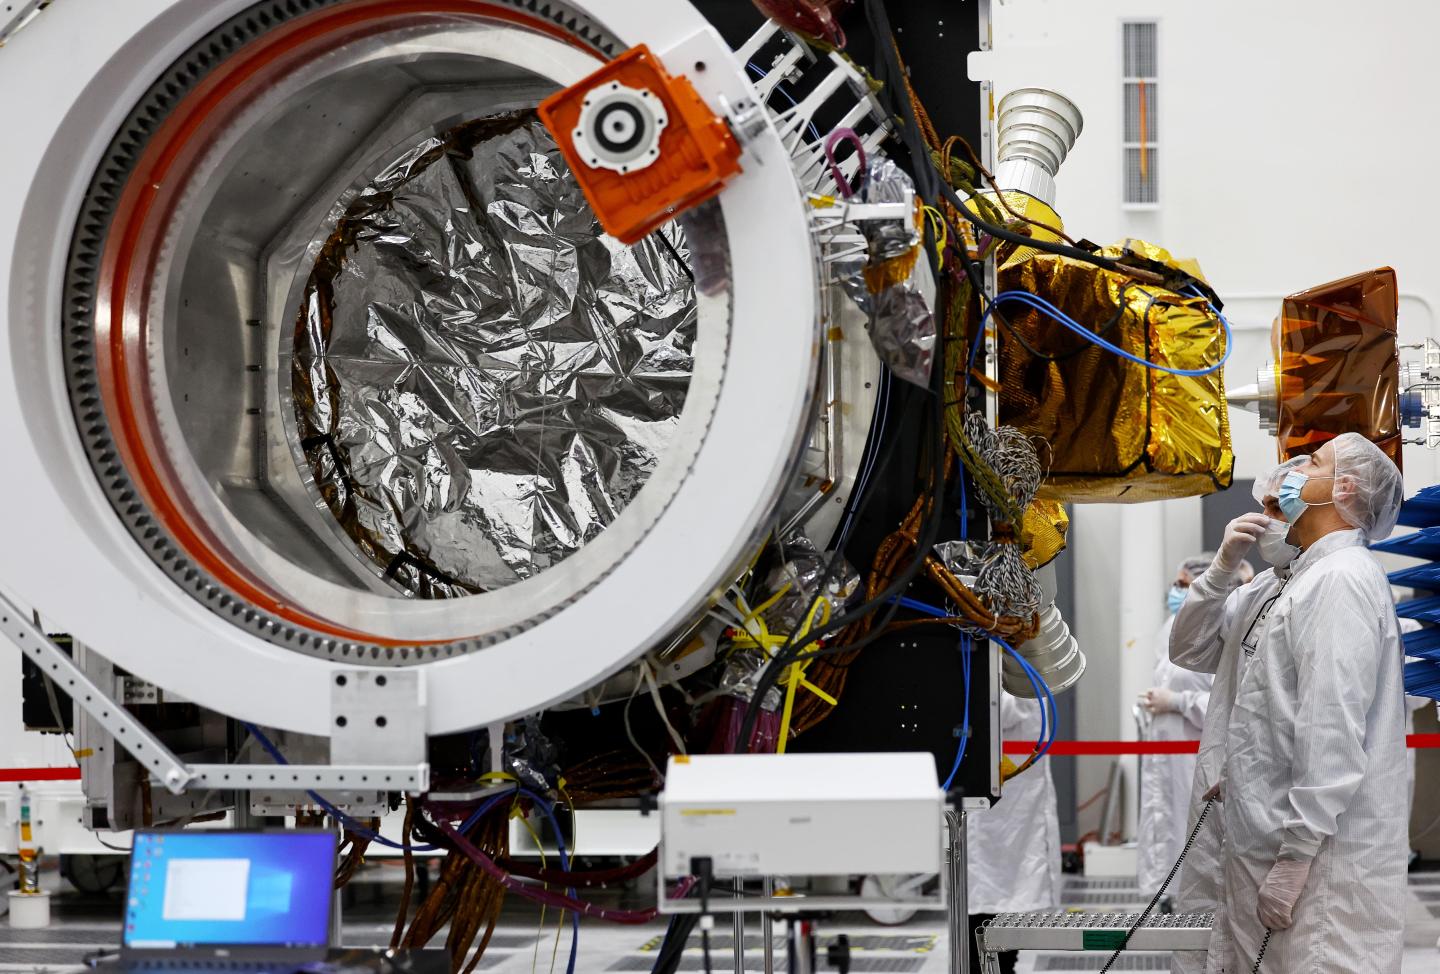
The NISAR satellite, a collaboration between the U.S. and Indian space agencies, will observe the entirety of Earth’s surface every six days using radar in two bandwidths. According to NASA, the signal from NISAR’s L-band radar will penetrate the forest canopy, bouncing off the tree trunks and the ground below. By analyzing the signal that reflects back, researchers will be able to estimate the density of forest cover in an area as small as a soccer field.
Because NISAR will pass over the same spot every six days, it will be able to paint a near real-time picture of forest loss globally. And because the satellite will be able to see the forest floor, the data could also offer clues to the cause of forest loss, whether it be fire, logging or disease.
In November, the company CTrees launched a new portal called the Land Use Change Alert system, or LUCA. The system alerts users when deforestation and degradation are spotted globally. It will start incorporating data from NISAR as soon as it comes online. With the new data, LUCA should be able to alert its users of forest changes on a weekly basis, arming companies, NGOs and governments with nearly real-time data to combat the growing problem.
Of course, cutting-edge technology, while crucial in the fight, can't halt deforestation on its own.
“Data by itself is just numbers,” says Steve Schwartzman, senior director of tropical forest policy at Environmental Defense Fund. “It is only effective where there is political will and commitment to act on what it tells us.”
Faster disaster response
As the climate warms, flooding, severe storms and other deadly extreme weather events are on the rise. Satellites are helping predict risk as well as targeting emergency responses.
SKAI, a tool that combines satellite data with AI technology, developed in partnership between Google and the World Food Programme, essentially acts as a quick-learning damage detector.
Using images from multiple satellites, taken before and after a natural disaster, SKAI can help quickly recognize exactly where disaster damage has occurred, helping direct recovery efforts where they’re needed most.
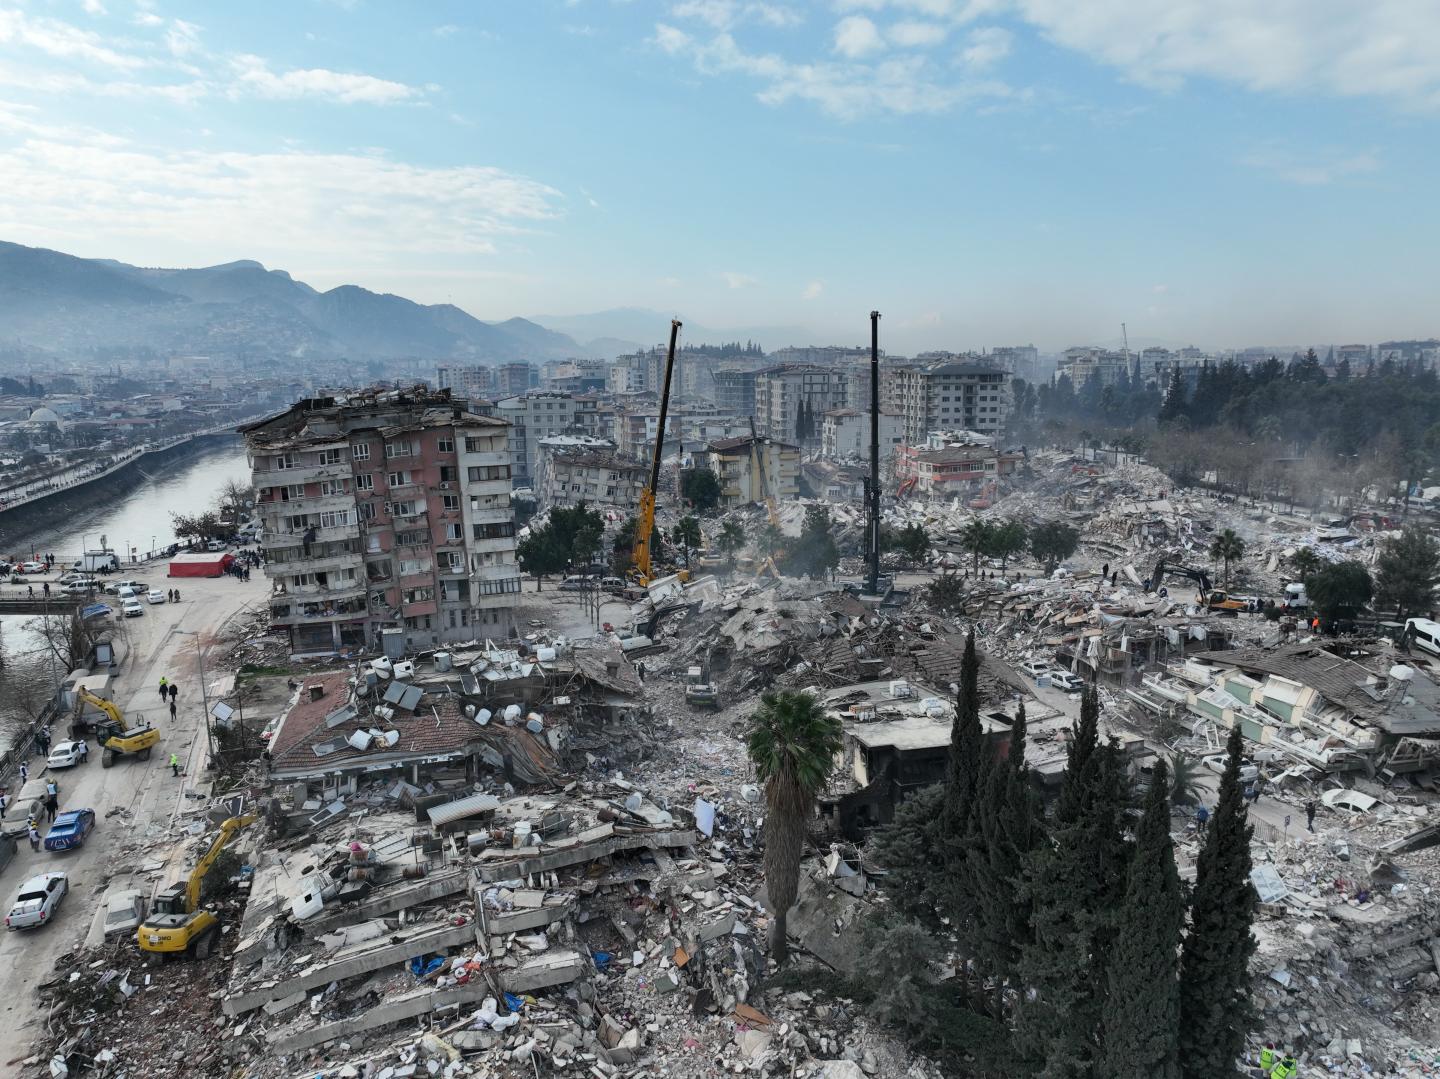
SKAI can swiftly identify changes, such as damaged buildings, and help local authorities estimate the number of people affected. After an earthquake hit Turkey and Syria in 2023, the SKAI team analyzed images of 600,000 buildings in just one month, identifying 28,000 structures that were heavily damaged or destroyed.
The team of just five people was also able to rapidly identify people in need of disaster assistance after Hurricane Ian in 2022, helping to deliver $2.1 million in aid to over 4,500 low-income families. This process was done in days instead of the standard weeks that it normally takes. SKAI has been shown to be 13 times faster and 77% cheaper than on-the-ground post-disaster assessments. And, of course, faster delivery of aid and assistance can be life saving.
SKAI’s fast reaction time is key, says Alex Díaz, Head of AI for Social Good & Crisis Response at Google. “The latest improvements in resolution and decrease in costs, all those things enable us to cut time to insight, and therefore cut time to action, which is the name of the game,” Díaz says.

